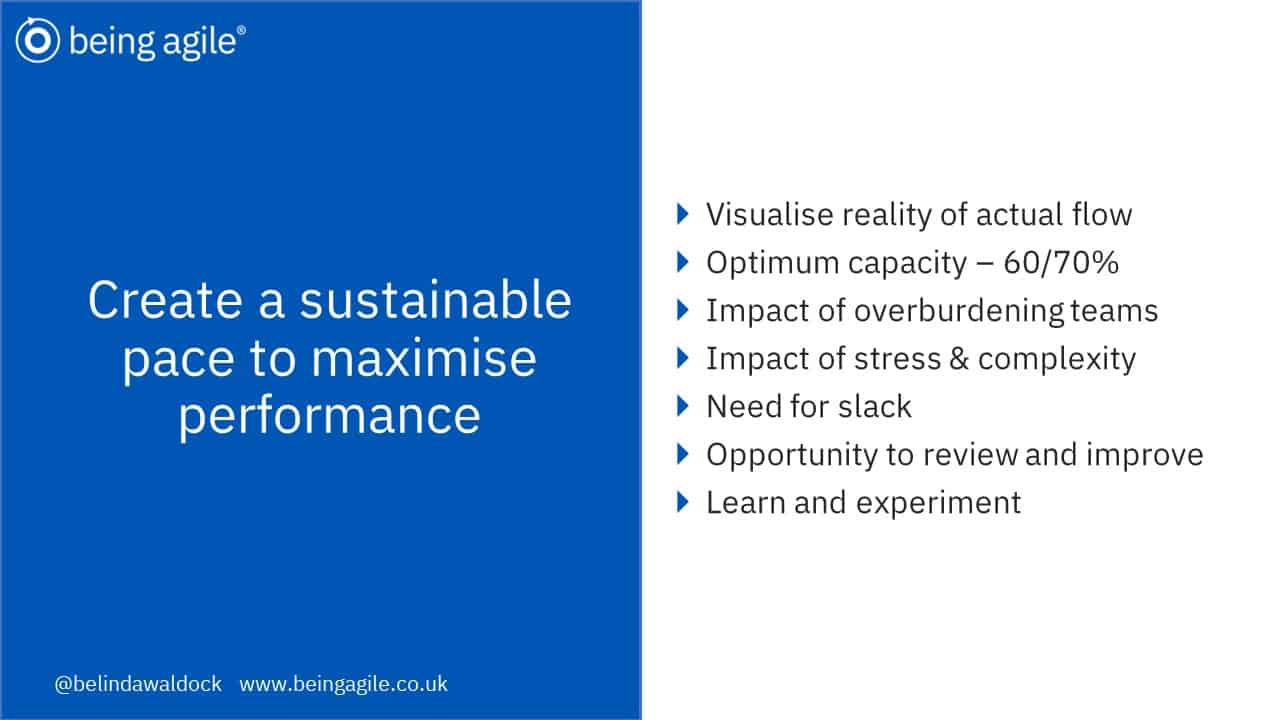
How working in sprints enables us to develop an agile sustainable pace of work, that in turn helps us to maximise our long term performance and well-being.
A key benefit of an agile approach is how working in sprints enables us to better develop an agile sustainable pace of work, that in turn helps us to maximise our long term performance and well-being
While a high pace of work may deliver high value in the short term it is not sustainable in the long term.
User stories : Over planning your sprint.
I have met team leaders, teams, and individuals who like to over plan their sprints, or at least ensure time is scheduled to 100%, if not 120% sometimes higher.
Its usually driven by common factors –
The belief that we need to be seen to be maximising our time and planning in full to be considered productive.
The belief that we can complete more work that is realistically possible.
Targets set higher than expected so that actuals come in at a level wanted, for example 70%.
This approach unfortunately creates a perpetual loop of failure. It hits morale, productivity and performance hard. It may seem counter intuitive but it is better to under plan a sprint, allow for slack, get the work done, and then select more if there is time, work on change and improvement, or use it for learning and development.
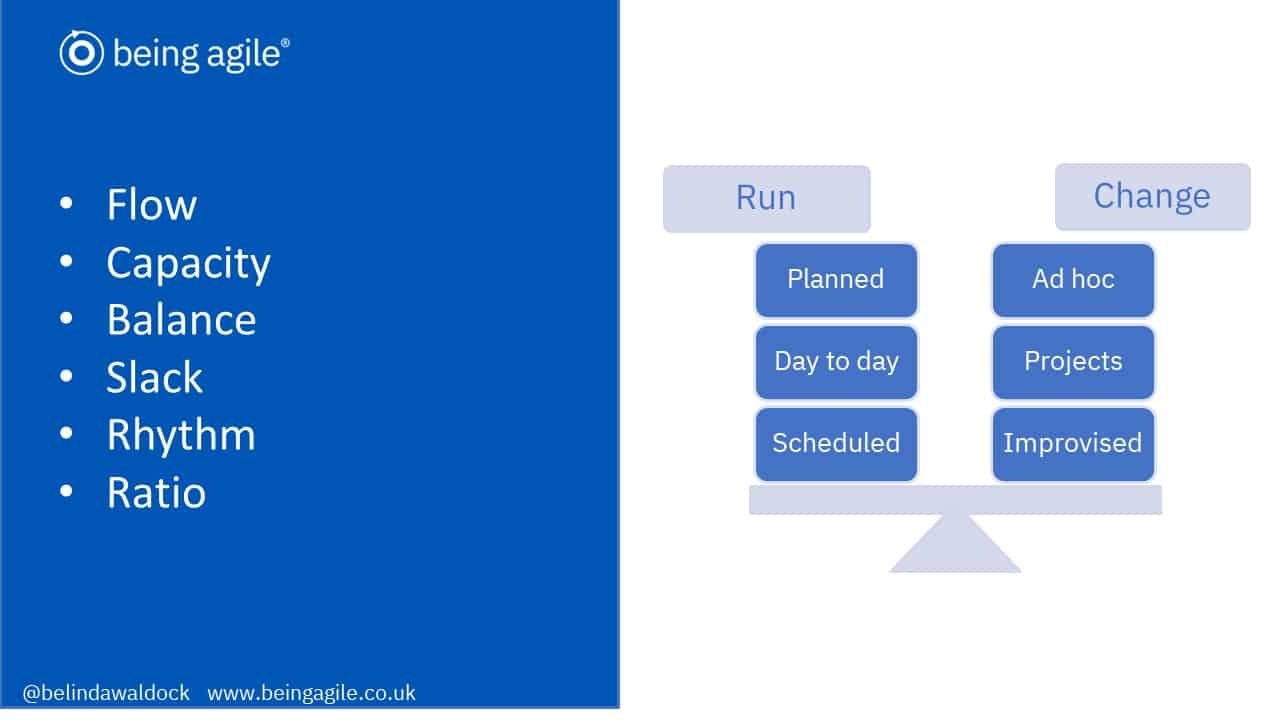
Factory lines for example are most effective, not at 100% capacity as this causes work to back up at bottle necks, instead they tend to flow most effectively around 60-70%, and work is pulled through the line based on the next most important/urgent order.
Similarly I see teams work most effectively when they are given 20-30% slack within their sprints, to allow time and resource for unplanned activity, improvement projects, learning and development, unexpected over run on planned work, or rework/improvement.
Using agile boards and tracking tools we can visualise our work and its flow, we can see the balance of work, what’s flowing, what’s blocked, we can review this to better plan our future sprints.
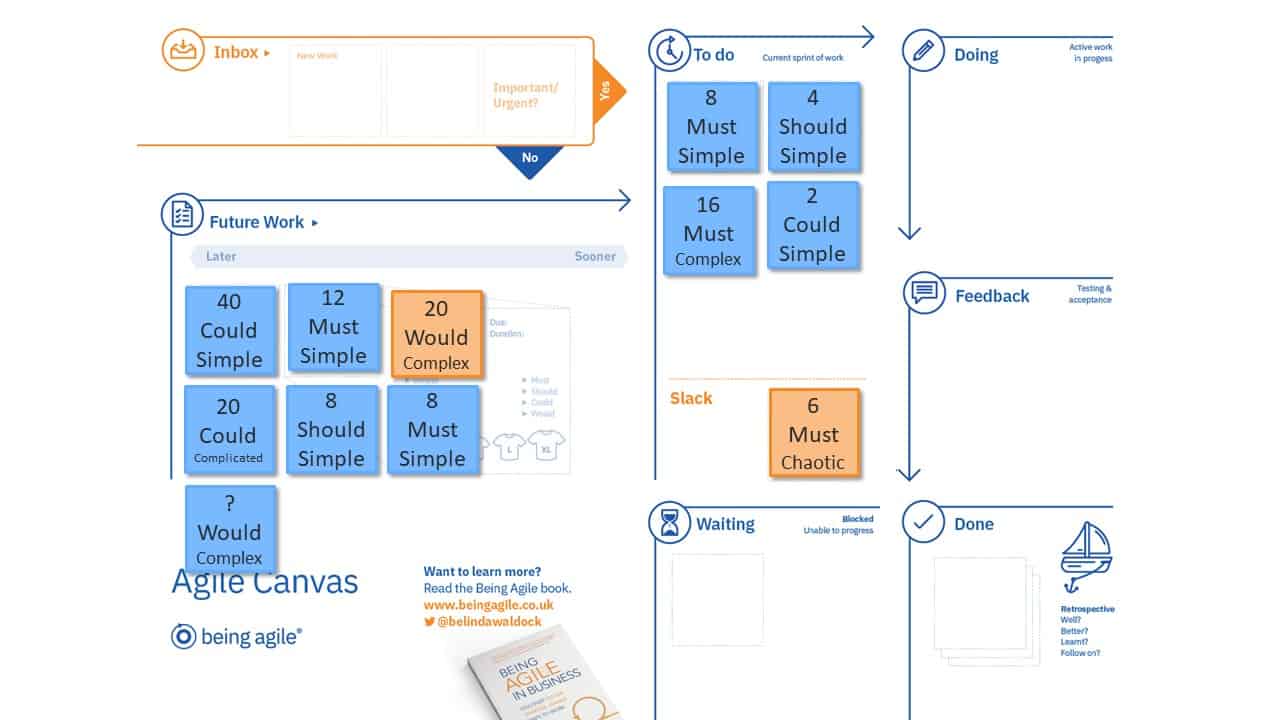
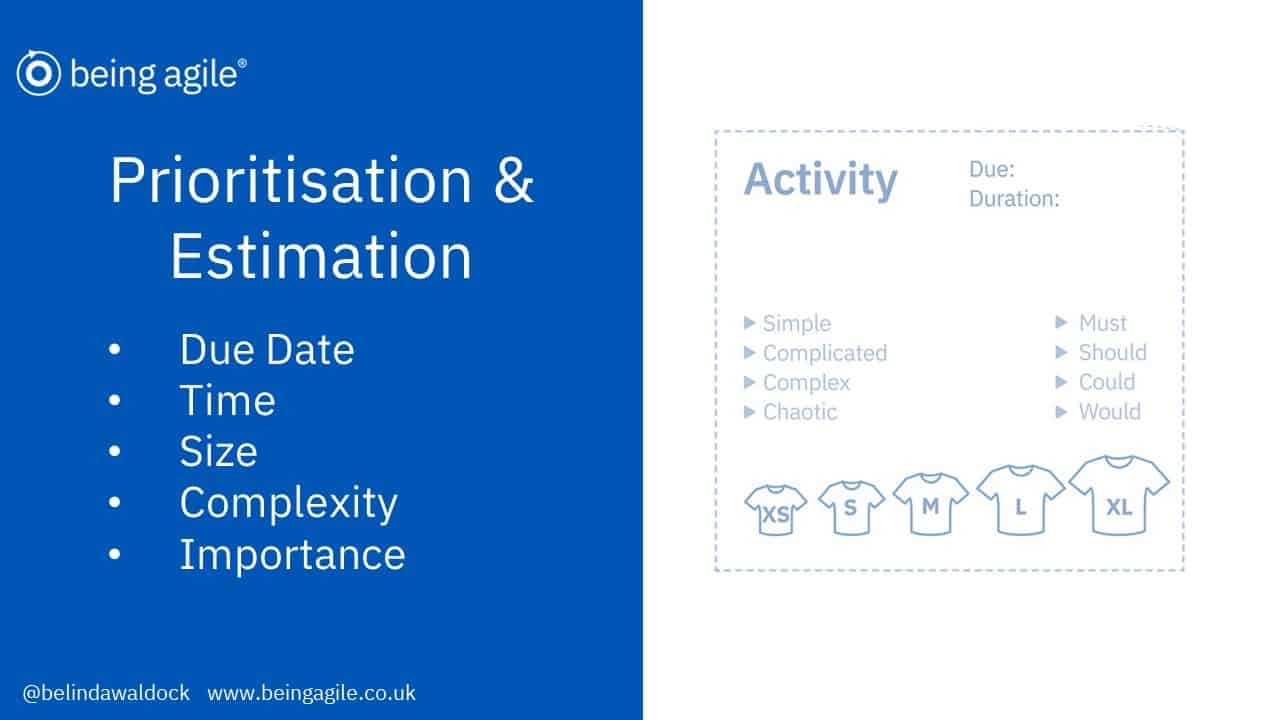
The above shows our previous canvas example with estimations and prioritisations added.
The sprint is for a week – 40 hours, we have given each item an estimate in hours. 30 hours of planned work has been scheduled, 10 hours remain for slack.
We can see our inbox items have also been ranked, the first important/urgent item is a must do, chaotic item, 6 hours. The second not important/urgent, complex and is a large 20 hour would like to have item.
If it was insisted the second inbox item was actioned as well we would not have enough sprint capacity as we have already planned 30 hours, and accepted an additional 6 hours with the first inbox item, therefore there is only 4 hours of our 40 remaining.
In order to accept this item into the sprint we would need to remove 16 points of work from the current sprint.
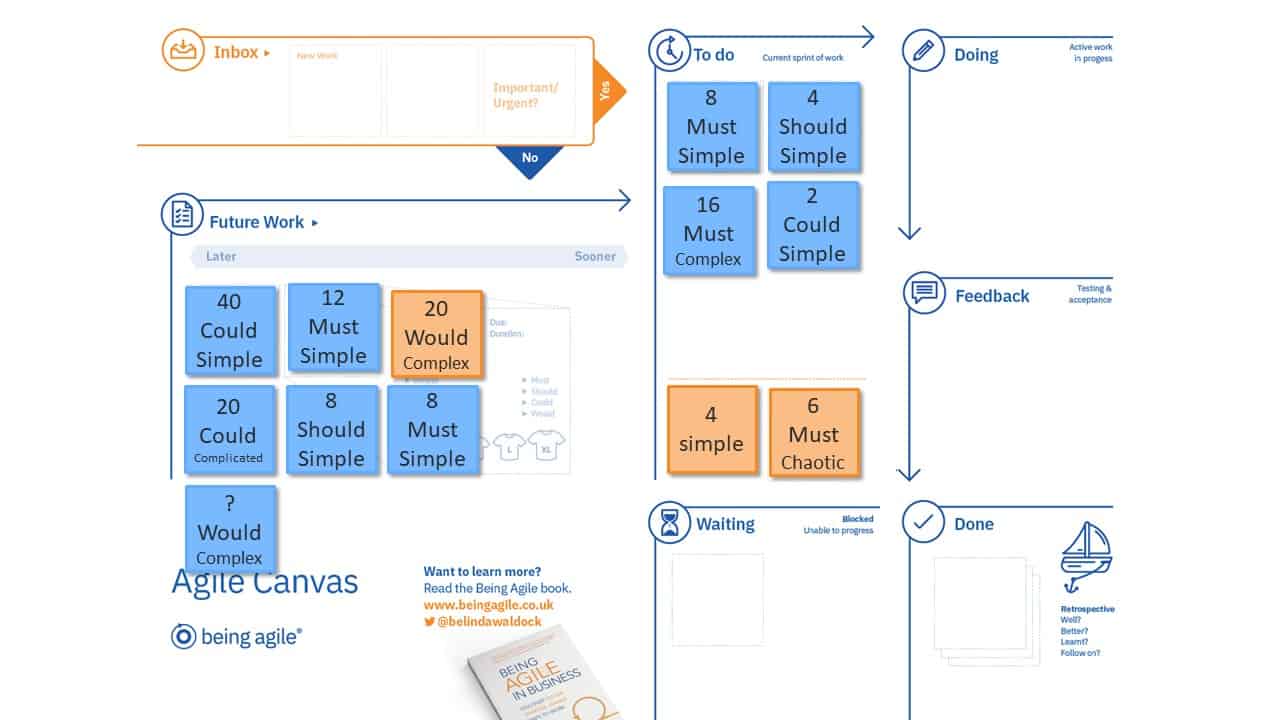
Making this point visually really helps to raise awareness and support decision making ourselves and with our customers, colleagues and partners.
Would we swap the 16 point Must do item plus our remaining slack for the 20 point would like to do item?
Could we find 16 more points capacity to action the item by adding more resource? Is the client happy to add 16 to their time/resource budget?
Could we break the item down or identify an initial activity that can be achieved within the 4 hours remaining – a simple task to help us to understand the complexity of the task and the value it might deliver. This would be my preferred option, it’s a compromise and it allows us to explore the new task/feature without blowing a large chunk of our budget.
Using agile methods helps us to visualise work and ensure that we don’t agree to more than we can realistically achieve. By having this visibility it helps teams to better manage their work flow and communicate their capacity to clients or colleagues to ensure that they can maintain their ‘agile sustainable pace’ and maximise performance.
I often remind teams that they are not a ‘Mary Poppins Bag’. In the film Mary Poppins, she has a bag which she unpacks when she arrives. A large carpet bag, she takes out all sorts of things including a tall hat stand, a mirror, a pot plant and a large lamp! A magic bag that seems to be able to hold much more than it appears! Your sprint is not a Mary Poppins bag, it has its limits!
Our sprints have limits, we are unable to take on more work than we can achieve. If we do we risk putting ourselves into perpetual failure.
Part of being agile is often what we stop doing as well as what we start.
To create an agile sustainable pace we must regularly review our estimations and priorities:
Are our estimates too high or low, do we need to adjust them?
Did we work on the right activities and priorities, do we need to adjust them?
What activities are flowing well? Why?
What activities are slow/blocked? Why? Capacity/ Capability/ Resource/ External blocks? How can we improve the flow?
What is our average ratio of planned : unplanned work during a sprint?
Record unplanned tasks – understand how much of your time is spent on ad-hoc rather than planned items.
How much new work are you receiving each sprint? How much is immediately actioned, how much is put into the back log for future sprints.
Burn Down Rate – is the work in your backlog of future work increasing, decreasing or staying the same?
Velocity – How much work is being completed per sprint?
Scope Creep – How much new work is being added to the back log of future work?
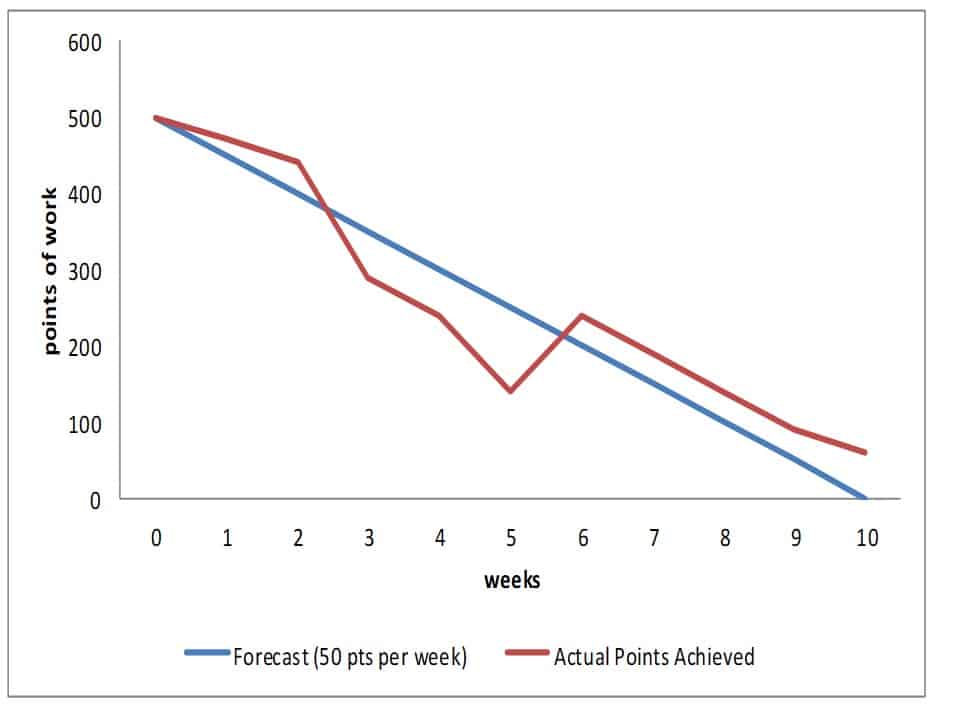
By totalling our estimates and tracking our work rate per sprint, we can estimate our burn down rate to predict when work will be completed.
The burndown shows a decrease as work is completed, but may drop if work is removed, or completed more quickly that estimated, or more resource is available.
The burn line may increase if work is added to the back log, takes longer than expected, or less resource is available, work rate is lower.
When planning our sprint we can use the learning, monitoring and feedback we receive to continuously ensure we are maintaining an agile sustainable pace.
Agile Manifesto 2.0 – Adapted – a small incremental improvement
Retrospective Sailing Game : Step by Step Guide, Video & Examples
Agile Estimation Games : Cup of Tea
Agile Planning Guide – Estimation & Prioritisation